
Examination of a blood smear is an integral part of a hemogram. Blood smear analysis allows quantitation of the different types of leukocytes (called the differential count), estimation of the platelet count, and detection of morphologic abnormalities that may be indicators of pathophysiologic processes. In some instances, a diagnosis may be evident. Deriving full value from blood smear examination requires a well-prepared, well-stained blood smear and some basic skills in the methods of assessment. For more information on how to make a good blood smear, please also refer to related links below. Though some automated hematology analyzers provide a differential count as part of their output, this does not fully take the place of a microscopic exam by an experienced observer.
Components of a blood smear
A well made blood smear consists of several areas: The feathered edge, the monolayer, and the body and base of the smear. All parts of the smear should be examined, however the monolayer is the area where the cells are examined in close detail and differential cell counts performed. Note that in a severely leukopenic animal, you will not find enough leukocytes within the monolayer to perform a 100 cell differential leukocyte count and you may have to use the entire smear and may not be able to count 100 leukocytes.
The feathered edge
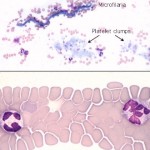
This is the end of the blood smear and should be completely present and fully stained (a smear that is “too long” will lack a feathered edge). This should be the first part of the smear that is examined at low power to detect platelet clumps and microfilaria, but should be avoided when evaluating blood cells at higher power. Abnormally large cells of potential diagnostic importance also tend to be drawn to the end of the smear.
- Platelets are partially activated and aggregated in many blood samples, especially in blood from cats. Platelet clumping, if not detected, can cause you to underestimate platelet number since there may be few individual platelets found during the high magnification examination.
- The leukocytes in the feathered edge are excessively spread and appear larger than they should. A high percentage of cells at the feather edgeμ are disrupted (smudged).
- Red blood cells here are completely flattened and lack central pallor, mimicking spherocytes. Abnormal shapes are difficult to recognize in this area.
Monolayer
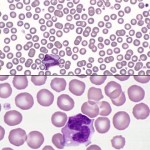
This is usually a distance of one 10x field behind the feathered edge and is the optimal area for examination of cells, because it dries quickly and cells are well spread (not overlapping) and not disrupted. Red blood cells are separated or barely touching, with little overlapping. In any species but the horse, rouleaux, consisting of stacks of 3 or more red cells, in this area is an abnormality suggestive of increased globulin concentration, which is common in animals with inflammatory disorders (and also seen in animals with neoplasms of B cells, which can produce abnormal immunoglobulins). White blood cells should also be uniformly distributed in this section.
- Note, that in very anemic animals, there may be too few RBC to have a good monolayer of these cells. Also in polycythemic animals (high RBC), it may be difficult to find an area where the RBC are not touching or overlapping. In these cases, following the above guide (1 or 2 fields back from the feathered edge) is useful for finding the right area to examine.
Body and base of the smear
These areas are usually too thick to evaluate cells under higher power. The thick area of a smear dries too slowly for leukocytes to spread out. The white cells here are shrunken and appear much smaller than in the quickly dried areas – individual leukocytes can be difficult to identify in this area and red blood cell changes are hard to appreciate. This area of the smear is usually scanned at low power to identify low numbers of potentially diagnostic cells (e.g. blasts in a leukemia), infectious agents (e.g. trypanosomes, microfilaria), and certain RBC changes (hypochromasia, agglutinates).
Examining a blood smear
A systematic approach is important so that all the available information is derived from each smear examined. This is our recommended protocol for blood smear examination: Scan the smear at low magnification, then use a higher magnification to perform a differential leukocyte count, enumerate nucleated RBC, estimate a platelet count, and evaluate red blood cell (RBC), white blood cell (WBC) and platelet morphologic features.

Scan the smear at low magnification (10x objective).
A WBC count can be estimated (with practice) when scanning across the smear (feathered edge through monolayer through body of smear).
- Check the feathered edge: Look for platelet clumps, large cells or infectious agents.
- Scan the rest of the smear (including the body and base; see above): Goals of scanning are to:
- Locate the optimal area for examination at higher magnification to perform a differential leukocyte count and examine morphologic features of blood cells. This optimal area is the monolayer (usually; see above), where cells are uniformly distributed and well spread.
- To check that leukocytes are uniformly distributed throughout the smear and not excessively concentrated at the feathered edge. In some poorly made smears, most of the leukocytes are dragged to the end of the smear (usually when the smear is made too slowly). If this is found to be the case, prepare another smear and move the spreader slide more quickly, which will help to spread the white blood cells more uniformly.
Once the optimal area has been located, switch to a higher magnification (50-100 x objective)
- Perform a differential leukocyte count: This is usually done on 100 leukocytes. When you have finished your scanning and have found the area of the smear where cells are optimally spread, turn to a higher magnification (50 or 100x oil immersion objective) and begin your differential count and morphology assessment. A high dry (40x) objective is not recommended since the magnification is too low to see adequately all the features of the cells. Begin the count by moving back and forth across the smear in a pattern that avoids covering the same territory (and that keeps you in the optimal viewing area as much as possible). This can done by moving sideways (preferred) or lengthways across the slide. Identify each leukocyte that is encountered until 100 cells have been counted and sorted by type, giving you a percentage of each cell type or a relative differential leukocyte count.
- “Normal leukocytes“: The five major categories of leukocytes in mammals are neutrophils, eosinophils, basophils, lymphocytes, and monocytes. We also count immature neutrophils (band neutrophils, metamyelocytes and myelocytes reflect different stages of maturity in neutrophils from most mature to least mature) as we encounter them and put them in a separate category called “band” neutrophils. All immature neutrophils (regardless of stage of maturation) are placed in the band neutrophil category at Cornell University, whereas other laboratories may distinguish the different immature stages.
- Other leukocytes: If other leukocytes that should not be normally present in blood are encountered, e.g. leukemic blast, mast cell, histiocyte (reactive macrophage), these can be just noted (if in low numbers) as part of assessment of WBC morphologic features or counted as “other cells” if enough are seen to be included in a differential leukocyte count.
- Enumerate nRBC: If any nucleated RBC are encountered during the differential leukocyte count, count them in a separate category (per 100 WBC) and do not include in the 100 cell differential leukocyte count. If more than 5 nRBC/100 WBC are counted, the total white blood cell count will need to be corrected, because automated analyzers (or our eyes) cannot discriminate between nucleated nRBC or WBC (they all look like WBC because machines and our eyes detect and count nuclei not cells). Few nRBC should be encountered in healthy and most sick animals, but some animals can have high nRBC counts (particularly those with regenerative anemias). Veterinary diagnostic laboratories usually do this correction for you, but if you are obtaining a total WBC and performing a differential leukocyte in-house, you will have to this correction. To correct the WBC count, you multiply the obtained count by the following: (100 ÷ [nRBC + 100]).
- Calculate an absolute differential leukocyte count: This is derived by multiplying the percentage of each counted cell type by the total WBC (in thousands/µL), corrected for nRBC, to get the number of each type of leukocyte (in thousands/µL). When you submit a hemogram to a veterinary diagnostic laboratory, the laboratory usually reports out the differential count in absolute numbers, i.e. they do this calculation for you.
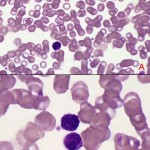
- Assess platelet numbers (using 100x objective): Platelets in mammals are anucleate cells that contain small pink-red granules. Shed into the blood from megakaryocytes in bone marrow, they are key players in the hemostatic process. Though most platelets are smaller than red cells, exceptions to this are not uncommon in cats and dogs, which can have large platelets normally in blood (particularly cats). In horses, platelets are often faint and can be hard to see.
- Estimate a platelet count: A platelet count can be estimated by obtaining an average of the number of platelets seen in several (recommended: 5-10) 100x objective fields. At this magnification, each platelet is approximately equal to 15,000 platelets/μL. In most species, you should count an average of 12-15 platelets per 100x field, which equates to 180-225 000 platelets/μL. Horses generally have a lower platelet count than other species, so an average of 6 platelets is within low reference intervals for horses, equating to a platelet count of 90 000/μL. The platelet count estimate should be done in the monolayer of the blood smear and will be affected by platelet clumps, which lower a count, either estimated or provided by a machine. At the Animal Health Diagnostic Center of Cornell University, a semi-quantitative estimate of platelet numbers (as outlined above) is provided which are based on reference intervals for the species in question (if available) as follows:
- Increased (Incr.): The count is above the reference interval for the species.
- Adequate (Adeq.): The count is within the reference interval for the species.
- Low?: The count is within the low end of the reference interval for the species or may be mildly decreased (i.e. the count is “equivocally low”).
- Low: The count is below the reference interval for the species.
- Very low: The platelet count is below a medical decision limit associated with spontaneous hemorrhage, i.e. < 30,000/µL.
- Estimate a platelet count: A platelet count can be estimated by obtaining an average of the number of platelets seen in several (recommended: 5-10) 100x objective fields. At this magnification, each platelet is approximately equal to 15,000 platelets/μL. In most species, you should count an average of 12-15 platelets per 100x field, which equates to 180-225 000 platelets/μL. Horses generally have a lower platelet count than other species, so an average of 6 platelets is within low reference intervals for horses, equating to a platelet count of 90 000/μL. The platelet count estimate should be done in the monolayer of the blood smear and will be affected by platelet clumps, which lower a count, either estimated or provided by a machine. At the Animal Health Diagnostic Center of Cornell University, a semi-quantitative estimate of platelet numbers (as outlined above) is provided which are based on reference intervals for the species in question (if available) as follows:
- Perform a morphologic assessment of blood cells (100x objective) to identify abnormalities in all cell lines: This part of the hemogram is the most subjective and difficult to quantitate. If abnormalities are found, these are semi-quantified as mild, moderate and marked or few, moderate and many, depending on the abnormality. Proficiency in recognizing and interpreting morphologic abnormalities comes only with practice and familiarity with normal features of each species. An important part of blood smear examination is to separate “fact from fiction” or artifact from pathologic changes. This can be challenging and also takes experience and proficiency.
- Red blood cells: We look for the following changes:
- Shape (poikilocytes): Acanthocytes, echinocytes, eccentrocytes, keratocytes, schistocytes, spherocytes, ovalocytes, target cells, stomatocytes. Semi-quantified as few, moderate or many.
- Size: Macrocytes, microcytes. Semi-quantified as few, moderate or many. Anisocytosis (variation in size) is semi-quantified as mild, moderate or marked.
- Color: Hypochromasia (too little hemoglobin), polychromasia (immature cells containing RNA or reticulocytes). Semi-quantified as mild, moderate or marked.
- Inclusions: Siderocytes (iron), basophilic stippling (RNA), Howell-Jolly bodies (retained nuclei), Heinz bodies (oxidized hemoglobin). Semi-quantified as few, moderate or many.
- Patterns: Agglutination (noted as present or absent), rouleaux formation. Rouleaux formation is semi-quantified as mild, moderate or marked.
- Infectious agents: e.g. Babesia, Anaplasma spp. Semi-quantified as few, moderate or many.
- White blood cells: We look for the following changes:
- Toxic change (immature features): Cytoplasmic basophilia, Döhle bodies, cytoplasmic vacuolation, toxic granulation, immature chromatin. Semi-quantified as mild, moderate or marked.
- Reactive lymphocytes (indicating antigenic stimulation): Semi-quantified as few, moderate or many.
- Smudged cells: These let you know how accurate the differential leukocyte count in. A few smudged cells will not impact the count but moderate to many will. Smudged cells are more frequently seen in “aged” or stored samples. Semi-quantified as few, moderate or many.
- Abnormal cells: Presence of leukemic blasts, dysplastic changes in leukocytes, iron in leukocytes, histiocytes, mast cells.
- Infectious agents: e.g. Anaplasma, Ehrlichia spp. Semi-quantified as few, moderate or many.
- Red blood cells: We look for the following changes:
- Platelets: Size and degree of granularity is assessed, along with the presence of infectious agents (Anaplasma sp., rare).
Related links
- How to make a good blood smear: Information from the Clinical Pathology Laboratory in the Animal Health Diagnostic Center at Cornell University website.