
Changes in total and differential leukocyte count are usually grouped into patterns, which facilitate interpretation. These patterns are:
- Stress leukogram
- Physiologic leukocytosis
- Inflammatory leukogram, including a table on how we use terminology to describe changes in mature (segmented) and immature (bands, metamyelocytes etc) neutrophils and how we use this terminology to understand what is going on to result in those changes (bone marrow response in relation to tissue demand or inflammation).
- Leukemia: More on leukemia is given in a separate section.
We have also provided useful tips on identifying the type of leukogram that is occurring (see below).
Stress leukogram
This is due to increased endogenous (or exogenous administered) corticosteroids. The classic leukogram pattern from increased corticosteroids (either exogenous or endogenous) includes a neutrophilia, lymphopenia, monocytosis, and eosinopenia. Not all of these changes will be present in any given animal. The most consistent finding is lymphopenia, followed by a mature neutrophilia (increase in segmented neutrophils, but not usually bands). Monocytosis from corticosteroids is fairly common in dogs and is uncommon in cats, horses and cattle.
- Experimental studies in cats: Treatment with immunosuppressive doses of corticosteroids (dexamethasone at 0.55 mg/kg/day or prednisone at 4.4 mg/kg/day for 56 days given to two groups of 7 cats) increased mean neutrophil and monocyte counts and decreased lymphocyte and eosinophil counts in 14 cats. However, neutrophilia and monocytosis were uncommon with lymphopenia being the most common finding (Lowe et al 2008). In another study of 10 allergic cats given 1-2 mg/kg/d prednisolone for 2 weeks, the mean neutrophil and monocyte counts peaked at 7 days, 1 hour after dosing, however it was not stated if the cats developed a neutrophilia or a monocytosis and lymphocyte and eosinophil counts were not provided (Khelik et al 2019).
- Experimental studies in horses: In one study, 8 ponies were given 2 mg dexamethasone IV (likely not a good mimic of a stress response) and leukocyte kinetics were monitored over several days (Targowski 1975). The neutrophil count increased to a mean of 11,000/μL within 2 hours, to reach a peak at a mean of 16,000/μL at 7 hours. Counts were still mildly increased at 48 hours (mean of 7,000/μL) and had returned to baseline by 72 hours. Lymphocyte counts began to decrease at by 4 hours with the nadir (1.5-2,000/μL) at 7-24 hours and normalization by 48 hours. Eosinophil counts decreased by 4 hours (mean of 200/μL) with the nadir (0-100/μL) between 7 and 48 hours. The eosinophil count rebounded by 72 hours. A mild monocytosis (mean 800/μL) was seen only at 48 hours in this group of ponies. In another study, 2 horses given 200 mg prednisolone IV (roughly 0.4 mg/kg, assuming a 500 kg horse) doubled their neutrophil counts (up to 14,500 and 8,200/uL) within 3 hours of injection (Carakostas et al 1981), compatible with a shift from the marginating to the circulating pool (estimated at 1:1 in horses [Carakostas et al 1981]). In 8 thoroughbred horses given 1.25 mg ACTH IV (likely the best experimental mimic of stress), the mean neutrophil counts peaked at 8,000/uL at 4 hours (baseline of 4,800/uL) then declined to near baseline by 24 hours. The lymphocyte count decreased from a mean of 2,800/uL to a nadir of 2,100/uL at 4 hours and was at baseline by 6 hours (Rossdale et al 1982).
- Experimental studies in ruminants: In 3 calves given 0.2 mg/kg prednisolone, the neutrophil count increased by 4 hours to peak at 9-11,000/uL at 10 hours (the latest measured time point) after administration IV (Carlson and Kaneko 1976). In pregnant ewes given dexamethasone (0.2 mg/kg), total leukocyte and neutrophil counts increased with a concurrent decrease in lymphocyte and eosinophil counts, with no change in monocyte counts. Counts returned to normal within 48 hours (Edelstone et al 1978).
The mechanisms for corticosteroid-related leukogram changes are as follows:
- Neutrophilia is mainly due to a shift from MGP to CGP. A small portion of the neutrophilia may also be due to increased release from bone marrow and delayed apoptosis. Generally, the neutrophil count is usually not increased more than 1x above the reference limit (the MGP to CGP ratio is 1:1), but can be as high as 2-3x the upper reference limit in cats (since they have a higher MGP:CGP ratio than other species). In general, it would be uncommon for a stress leukogram to increase a segmented neutrophil count >10-12,000/μL in horses and ruminants. Note, that animals on chronic immunosuppressive (high) doses of steroids (not just a release of endogenous steroids due to “stress”), a mild left shift (band neutrophil count of 300 to 400/uL) may be seen without toxic change or an increase in mature segmented neutrophils (segmented neutrophil count is usually normal [personal observations]).
- Lymphopenia is due to multiple mechanisms, including decreased efflux from lymph nodes, decreased proliferative and activation cytokines (e.g. IL-2) for lymphocytes and lymphotoxic effects (induction of apoptosis, only more chronic conditions and likely with higher doses of steroids).
- The mechanism for the monocytosis is unknown, but it could be due to a shift from marginating to circulating pool, if these pools exist for this leukocyte.
- Eosinopenia is thought to be due to decreased release from the bone marrow, although the precise mechanism is unknown.
Care must be taken when using the term “stress response” to refer to a leukogram. A stress leukogram is specifically referring to the results of corticosteroids. It is tempting to use the term stress leukogram when describing a nervous animal, but these animals are likely to have an epinephrine response rather than a corticosteroid response. So only use the term “stress leukogram” when referring to changes that you are attributing to corticosteroids.
Causes of a stress leukogram are:
- Endogenous stress: Chronic or acute increases in corticosteroids. This is expected in ill animals.
- Hyperadrenocorticism: Excess endogenous corticosteroids.
- Exogenous corticosteroid administration: In dogs, this may be accompanied by increased liver enzymes (especially ALP).
Other changes in clinical pathologic results that may be seen with a stress leukogram are:
- Hyperglycemia: Due to corticosteroids stimulating gluconeogenesis (requires more chronic increase in steroids).
- Increase in ALP activity: Only in dogs and with chronic endogenous corticosteroids or exogenous corticosteroids.
Physiologic leukocytosis
This is due to epinephrine or norepinephrine and is called a “flight or fight” response. Changes on the leukogram due to epinephrine responses are most commonly seen in cats (of any age), young horses (1 year of age or less), and possibly younger animals of other breeds. The typical pattern is mild neutrophilia (mature cells with no left shift) and lymphocytosis (sometimes called a “physiologic lymphocytosis”). These changes are usually transient, and will diminish within about 30 minutes after the animal calms (Rose et al 1983).
- The neutrophilia is due to a shift from the MGP to the CGP. A left shift will not be seen.
- The lymphocytosis is thought to be due to release from the spleen. It is uncommon for the lymphocyte count to exceed 10 thousand/μL, but we have seen rare cases in cats of an epinephrine-related lymphocytosis of about 30 thousand/μL and colleagues have reported higher values (very very rare). In 16 yearling unbroken quarterhorses, lymphocyte counts ranged from 5,600 to 14,000/uL, with higher counts seen in the horses caught last (Schalm’s Veterinary Hematology, 4th edition). A few yearlings had a mild neutrophilia (up to 14,000/uL) and monocytosis (up to 1,100/uL) as well. A mild increase in lymphocyte percentages occurred within 5 to 30 minutes of epinephrine injection (2 mg) in goats (from 60±4% to a peak of 70±4% at 5 minutes), which was lacking in splenectomized animals, however there was minimal change in the total leukocyte count (Abdelatif and Abdalla 2012).
- An eosinophilia and basophilia may accompany the above changes in cats.
Other changes in clinical pathologic results that may be seen with a physiologic leukocytosis are:
- Hyperglycemia: Due to epinephrine stimulating glycogenolysis (rapid response).
Inflammatory leukogram
The blood neutrophil count with inflammation represents the balance between tissue demand and bone marrow supply. The leukogram pattern can be variable depending on the source and severity of the inflammation. The changes bulleted below are often identified on the CBC from an animal with inflammation, but it is possible to have inflammation in an animal that does not show an inflammatory leukogram. This occurs particularly with localized inflammation that is not inciting a systemic inflammatory response (with associated clinical and clinical pathologic manifestations, such as fever, an inflammatory leukogram, hypoferremia and increased globulins). If there is other clinical or laboratory evidence of inflammation in an animal, do not let the lack of an inflammatory leukogram dissuade you from considering that an inflammatory process may be occurring. Also remember, that a single hemogram is but a “snapshot” in time. Since changes in the hemogram can occur frequently, monitoring hemogram results frequently (every 12 to 24 hours) can be very helpful in determining the course of an inflammatory response and response to treatment. Regardless, never treat laboratory data, always treat the patient.
With the classic inflammatory leukogram, the bone marrow senses an increased demand for neutrophils (through cytokine stimulation). The bone marrow initially responds to this demand by releasing the storage pool of post-mitotic mature and band neutrophils, which results in a neutrophilia with a left shift (with fewer band than segmented neutrophils, i.e. not degenerative), in most species, other than cattle (which release earlier forms). Cytokines (such as granulocyte and granulocyte-monocyte stimulating factor) also kick in and stimulate granulopoiesis within 3-5 days. Thus, the following changes are seen with a classic inflammatory leukogram:
- Neutrophilia (anything from very mild to very severe (rarely over 80 thousand/µL – mostly with sequestered inflammation that has induced a marked granulocytic hyperplasia), depending on the severity of the inflammation and effective response by the marrow. In general, dogs tend to have the highest degree of neutrophilia than other animals.
- Left shift in neutrophils: The more severe the left shift (with more immature neutrophils, such as metamyelocytes, myelocytes and rarely progranulocytes, not only bands, being released), the more severe the inflammatory stimulus.
- Toxic change: This usually, but does not always, accompany an inflammatory leukogram. Mild, chronic or resolving inflammation may not result in toxic change (which indicates immaturity and accelerated release versus a true toxic effect on these cells). Cytokine stimulation without infection, e.g. cytokine secretion stimulated by cancer (paraneoplastic response) and immune-mediated hemolytic anemia in dogs can have a moderate to marked neutrophilia with a left shift (sometimes to metamyelocytes and myelocytes), with only mild or sometimes no evidence of toxic change. Usually, a moderate to severe inflammatory response, particularly that due to bacterial sepsis (but not limited to bacterial sepsis) will result in a left shift in neutrophils and toxic change.
- Monocytosis: This may or may not be part of an inflammatory leukogram. A monocytosis is usually seen with inflammation when it is more long-standing or resolving. However, in some animals, the increase in monocytes is quite mild.
- Concurrent lymphopenia (with or without eosinopenia): A lymphopenia (and eosinopenia) frequently accompany an inflammatory leukogram, but this does not always happen. We usually attribute this due to concurrent endogenous stress (corticosteroid release), although inflammatory cytokines may directly cause a lymphopenia (through shifting hematopoiesis to granulocytic lineages and downregulating lymphopoiesis). In some cases, a mild lymphocytosis may be seen with chronic inflammatory conditions that incite a decent antigenic response, e.g. pyometra, some protozoal infections (e.g. theileriosis, trypanosomiasis, young horses recovering from Potomac horse fever or Anaplasma phagocytophilum).
With overwhelming inflammation, the bone marrow is unable to release enough leukocytes to keep up with peripheral demand, leading to leukopenia. The typical leukogram pattern is:
- Neutropenia with a left shift, which may include more immature forms than bands (metamyelocytes, myelocytes). Some animals may have more immature than mature/segmented neutrophils (i.e. may see degenerative left shift). A severe neutropenia and degenerative left shift (often to myelocytes) is common in cattle with acute inflammation (e.g. acute mastitis or metritis). This is because cattle do not have large reserves of neutrophils in the storage marrow pool to release in respond to an acute inflammatory stimulus. In other species, a neutrophilia with a left shift is more commonly seen with acute inflammation and a neutropenia with a left shift only ensues when the inflammation is very severe and overwhelming.
- Toxic change: Moderate to severe toxic change in neutrophils should be seen in this situation.
- Concurrent lymphopenia (with or without eosinopenia): See above.
Sequestered inflammation, such as a closed pyometra or an abscess, can result in a moderate to marked neutrophilia (with or without a left shift) and usually with little or mild toxic change (mimicking a paraneoplastic leukocytosis). There may be a concurrent monocytosis. Rupture of the lesion will result in a more severe inflammatory leukogram and corresponding clinical signs (i.e. can be life-threatening).
Acute endotoxemia results in a different hematologic pattern, which may vary between species.
- Dogs: Injection of endotoxin (1 -200 ug/kg) to 5-6 dogs resulted in an acute leukopenia (1-3 hours, nadir 2 hours), followed by a leukocytosis due to a neutrophilia by 24-48 hours. A left shift was evident at 8-24 hours. Mean leukocyte counts were still increased above baseline (but within reference intervals) by 5-7 days (Hoshiya et al 2001, Higgins et al 2003). Mean lymphocyte counts within 2-8 hours and were within reference intervals (but still lower than baseline) at 24 hours. Mean monocyte and eosinophil counts were decreased between 2 and 8 hours, with recovery of the monocyte count by 24 hours, whereas eosinophils were still suppressed (Higgins et al 2003). The mean platelet count decreased, with the nadir (mean, 195,000/uL with SD of 46,000/uL) at 24 hours. Albumin decreased by 24 hours (to a mean of 2.7 ± 0.1 mg/dL), whereas an increase in globulins and acute phase proteins (serum amyloid A and C-reactive protein) was seen at 8 and 2-4 hours, respectively (earlier increase in serum amyloid A versus C-reactive protein) (Higgins et al 2003).
- Horses: Consistent changes appear to be a rapid neutropenia (1-3 hours), followed by a neutrophilia (6-24 hours), a rapid lymphopenia, which may persist for 24 hours, a rapid transient thrombocytopenia (<2 hours) and a rapid hyperglycemia (1-3 hours) after infusion of endotoxins in adult horses (Burrows and Cannon 1970, Burrows 1979, Lavoie et al 1990, Baskett et al 1997). Infusion of endotoxin into neonatal foals results in a rapid, transient neutropenia (within 1-4 hours, potentially without a left shift or toxic change, likely due to rapid margination of neutrophils) and lymphopenia (mechanism unclear) within a few hours, followed by a neutrophilia by 6-24 hours (likely due to release of bone marrow stores). The lymphopenia is too acute to be attributed to a stress response, being seen within 1-3 hours after endotoxin infusion (Lavoie et al 1990). Some foals had a mild transient thrombocytopenia (Lavoie et al 1990), which has been attributed to splenic or lung sequestration. A similar rapid development of neutropenia (<1,000/uL), by 60 minutes and persisting for 4 hours, was seen in 6 Shetland ponies given various doses of E coli endotoxin IV. In the latter studies, the ponies also developed a hyperglycemia (average 200 mg/dL) within 30 minutes of endotoxin administration, which persisted for an hour. The PCV increased from an average of 30% to 45% for up to 4 hours after endotoxin was given (attributed to splenic contraction, but could be secondary to fluid shifts into the extravascular space) (Burrows and Cannon 1970). Similar changes were seen in ponies given IV (150 ug/kg), a single high dose (300 ug/kg) of LPS intraperitoneally (IP) or multiple doses (100 ug/kg) IP at 3 hour intervals. The neutrophil counts decreased to a nadir between 1-4 hours after endotoxin and stayed low (less than 3,000/uL) for up to 10 hours in IP-dosed horses. This was followed by a neutrophilia at 24-48 hours (ranging from an average of 7,000/uL after a single IP dose to an average of 21,000/uL after a single IV dose). In contrast, the average neutrophil count remained around 3-4,000/ul after multiple IP doses for this time frame. The ponies also had an increase in PCV, which persisted for up to 10 hours after IP dosing but had returned to baseline by 8 hours after IV administration. The lymphocyte count decreased within 1 hour to a nadir (average 1,500-2,200/uL) between 6-24 hours after endotoxin (all doses and routes). The platelet count also decreased rapidly (resulting in a mild thrombocytopenia, with an average count of 80,000/uL) by 1 hour after administration, followed by a mild increase (but not to baseline levels). Mean glucose concentration spiked between 1-3 hours, whereas an obvious increase in mean plasma fibrinogen concentration was only seen at 48 hours after multiple IP doses versus a single IP dose (Burrows 1979).
- Cattle: Internal studies at Cornell in dairy cattle in early lactation show that neutrophils decrease rapidly within 1 hour of LPS injection (250 ng/kg) and rebound by 24 hours. A left shift was evident at 4 and 24 hours. This data mimics that seen in other species, indicating consistency in the response to endotoxin injection in experimental studies.
Causes of inflammation are many and include:
- Infectious agents: Bacteria, viruses, protozoa, fungi. Some infectious agents, e.g. Theileria in cattle, can cause a concurrent lymphocytosis (which may reflect chronic antigenic stimulation).
- Immune-mediated conditions: Vasculitis, polyarthritis.
- Cancer: This could be due to cytokine production by the tumor cells (paraneoplastic response), a host response to the tumor, or tumor necrosis.
- Necrosis: Hypoxic injury from anemia, infarct, tissue burns.
- Foreign body: e.g. migrating grass awn.
Other changes in clinical pathologic results that may be seen with an inflammatory leukogram are:
- Thrombocytosis: Due to inflammatory cytokines, such as interleukin-1 and 6. As noted above, acute endotoxemia can result in a transient thrombocytopenia.
- Changes in albumin and globulins: This is usually comprised of low albumin or high globulin concentrations or a combination of both. The low albumin concentration is due to a negative acute phase response (downregulation of production in hepatocytes) and the high globulin concentrations will be due to an acute phase response (increased production of α2 globulins by hepatocytes) or antigenic stimulation (polyclonal increase in immunoglobulins) or a combination of both.
- Changes in the iron panel: This could be hypoferremia with low % saturation or hypoferremia with low TIBC and normal % saturation.
- Changes in glucose: If there is concurrent stress, hyperglycemia may be seen. With sepsis, hypoglycemia may be evident.
Note that eosinopenia can be seen in experimental models of acute bacterial infection in rodents and rabbits, which decreased concentrations not being attributable to concurrent cortisol release (the decrease in eosinophils can precede the increase in cortisol concentrations, occurring quite rapidly within an hour, with a persistent decrease for up to 24 hours) (Bass 1975, Bass 1977, Bass et al 1980). Eosinopenia can also be a finding in severely ill patients with bacterial and viral infections (Davido et al 2017, Le Borgne et al 2021).
Left shift terms
Terminology that you may encounter associated with inflammatory leukograms can be confusing, including degenerative and regenerative left shift. The key concept is: Is the bone marrow responding to the tissue draw or inflammation (release of cells or hyperplasia), is the response sufficient to combat the inflammation (hyperplasia in longer-standing inflammation) or is the inflammation winning (with or without hyperplasia)? We have provided a table below that hopefully gives a useful guideline on how we interpret changes in mature and immature neutrophil numbers (remember, there are exceptions to the rules). Note also that immature applies to all immature neutrophil stages that can be seen in blood (bands > metamyelocytes > myelocytes > progranulocytes, i.e. a proportionate left shift where more mature stages outnumber the more immature stages).
| Segmented (mature) neutrophil count | Relative proportions | Terminology | Hyperplastic marrow | Comments | ||
| Low | Immature > Mature | Degenerative left shift | NO | Acute (bovine in particular, also horses, less common in other species with acute inflammation due to release of neutrophils from bone marrow stores) | ||
| Low | Mature > Immature | Left shift* | Not likely | Not typical of inflammation | ||
| Normal | Immature > Mature | Degenerative left shift | Maybe | Uncommon, tissue draw (inflammation) likely or rebound from marrow injury – Monitor (who is winning?) | ||
| Normal | Mature > Immature | Left shift** | Likely | Substantial tissue draw remains – Monitor | ||
| High | Immature > Mature | Left shift*** | Yes | Substantial tissue draw remains – Monitor | ||
| High | Mature > Immature | Regenerative left shift | YES | Marrow is meeting or exceeding demands | ||
| * This is not a typical pattern seen with inflammation, but is considered by some clinical pathologists to be a degenerative left shift. A production defect should be considered (which is why some avoid calling this pattern degenerative; as the term implies an inflammatory draw). If there is toxic change, a concurrent inflammatory stimulus is probably occurring, which could be a consequence of the low mature neutrophil count. ** In this scenario, the strict criteria of the immature forms outnumbering the mature forms is not met (hence the term degenerative may not be applied by some). However, this is akin to an anemic animal who has some reticulocytes, but not enough. At this point in time, we do not know if the marrow is undergoing hyperplasia or just releasing immature cells to meet demand and not keeping up. Alternatively, the marrow may not be producing enough cells to meet tissue demand for other reasons. *** Some clinical pathologists call this a degenerative left shift because immature forms are more numerous than mature or segmented forms. Others prefer not to call this a degenerative left shift, because the marrow is responding and hyperplastic. The term “degenerative left shift” has negative clinical implications, and in this scenario the body is responding better to the inflammation than an animal with a normal or low segmented neutrophil count. Realize in these cases, you have evidence that the marrow is hyperplastic, but you don’t know yet if the response is going to be adequate or if the tissue draw (inflammation) is stronger than the marrow’s response. Only serial monitoring will tell which way the animal is heading. |
||||||
| Table taken from teaching notes prepared by Dr. Erica Behling-Kelly for Cornell students. | ||||||
Stress or inflammation?
Both stress and inflammation can manifest with similar leukogram patterns, i.e. a mature neutrophilia (no left shift or toxic change), monocytosis and lymphopenia and eosinopenia (although all changes may not be present in every animal). Under these situations, it is unclear from a single hemogram, if the changes are due to stress or inflammation. In these cases, you should use other laboratory data (e.g. hyperglobulinemia, hypoferremia, hypoalbuminemia) and clinical data (e.g. fever) to decide which you think is more likely (or possibly both may be occurring). The degree of change may also be helpful as a stress leukogram is uncommon in species other than the dog and is usually associated with a mild increase in neutrophils. Measurement of sequential hemograms may also be helpful (to document improving or worsening inflammation or an absence of stress).
Pattern differentiation
The following table may help with differentiating between leukogram patterns and are guidelines showing commonly seen changes (but not all scenarios are covered and there are species differences that cannot be put in the table). Note, that clinical information, results of other testing (e.g. imaging) and other clinical pathologic results will also assist with leukogram pattern differentiation (and there are exceptions to every rule).
| Pattern | Neutrophils | Left shift? | Lymphocytes | Monocytes | Toxic change | Evidence of inflammation |
| Stress | ↑ | No | ↓ | ↑ (dogs, especially) | No | ±* |
| Physiologic | ↑ | No | ↑ (cats, young horses especially) | No change | No | Not usually |
| Mild/chronic inflammation | ↑ | ± | N or ↓ | ↑ (if chronic, especially) | No | Hopefully |
| Acute inflammation** | ↑ | ↑ | ↓ | N or ↑ | Usually | Yes |
| Overwhelming inflammation | ↓ | ↑ to ↑↑ | ↓ | N | Yes | Yes |
| Sequestered inflammation | ↑↑ | ± | N or ↓ | N or ↑ | ± | May be difficult to find |
| * A stressed animal may have concurrent inflammation. ** Acute inflammation in cattle will result in a neutropenia with a left shift as indicated above. Peracute endotoxemia can result in a transient neutropenia and lymphopenia. |
||||||
Leukemia
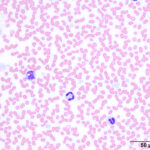
Leukemia is defined as the presence of neoplastic cells in circulation and/or the bone marrow. Leukemias are classified in two ways, by stage of maturation (acute or chronic) and by lineage (myeloid or lymphoid). There is also a third “designation” of leukemia, which is a leukemia that is secondary to lymphoma (an extramedullary tumor of lymphoid tissues) or what we call the leukemic phase of lymphoma (which means that the lymphoma is in the blood and/or bone marrow). The most common types of leukemia we see are chronic lymphocytic leukemia (CLL) and acute myeloid leukemia (AML), which can consist of any myeloid (non-lymphoid) lineage. Acute lymphoid leukemia (ALL) is less common in most species. Chronic myeloid leukemia (CML) is quite rare.
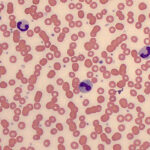
- Acute leukemia (ALL or AML): These are immature cells (blasts) in blood or an excess number of blasts in bone marrow. The typical hemogram pattern with acute leukemia is a non-regenerative anemia, neutropenia, and thrombocytopenia (i.e. pancytopenia), usually with a large number of blasts in the leukogram. Some animals may have few or no blasts (this is typical in horses with acute leukemia). Blasts are identified as large cells (larger than a neutrophil), with a relatively large nucleus, fine chromatin, and possibly prominent nucleoli. Some immature cells, particularly with ALL, are small to intermediate and can be difficult to distinguish from normal lymphocytes (they usually have more euchromatin than a normal lymphocyte, i.e. the chromatin pattern is fine versus smudged or blocky).
- Chronic leukemia: This is a neoplastic proliferation of a differentiated or mature blood cell type, and has a more prolonged, indolent clinical course and a much better prognosis than acute leukemia. The only type of chronic leukemia you are likely to see in practice is chronic lymphocytic leukemia (CLL). Animals with CLL have a good prognosis and can often live for months or years with little or no treatment. The disease is commonly diagnosed as an incidental finding on a hemogram. With CLL, the leukogram shows a marked lymphocytosis (often more than 20 thousand/µL, and sometimes more than 100 thousand/µL) where the lymphocytes are morphologically fairly normal (small with clumped chromatin). This must be differentiated from other causes of lymphocytosis (e.g. hypoadrenocorticism, reactive lymphocytosis) but the latter are a far less common cause of lymphocytosis than CLL in dogs and cats.
- Lymphoma with a leukemic phase: Cells from a primary lymphoma can be seen in blood and/or bone marrow (i.e. a leukemic phase) and is called stage V disease in veterinary medicine. The cells will mimic their tissue counterparts and will be small, intermediate or large in a small, intermediate or large cell lymphoma, respectively. Since normal blood lymphocytes are generally small, with some intermediate cells, it is difficult to identify a leukemic phase of a small or intermediate cell lymphoma, unless there are many of the tumor cells in blood and/or bone marrow. Even then, we need to distinguish between a primary lymphoma with a leukemic phase or a primary leukemia (CLL or ALL), which is based on the main site of involvement: Blood for a CLL, marrow for an ALL and extramedullary tissue for lymphoma). Blasts from AML, ALL, and stage V large cell lymphoma all have a similar microscopic appearance, so to distinguish them we must rely on other information from the physical examination, hemogram, bone marrow cytology, and specialized testing such as flow cytometry and cytochemical staining. The classic patterns for each of these are summarized in the table below, although in reality these distinctions are not always this clear and there are always exceptions. For more on this, refer to types of leukemia.
Useful hints
When interpreting WBC results on a hemogram, it is useful to ask the following questions:
- Is this a young animal? (or should I expect an age- or epinephrine-associated lymphocytosis?)
- Is there evidence of endogenous corticosteroid release (“stress”) or is the animal on corticosteroid treatment? This would be supported by a lymphopenia and/or eosinopenia. A neutrophilia, without a left shift, with or without a lymphopenia or eosinopenia could be due to inflammation or corticosteroids, so you would need to evaluate other findings (clinical and laboratory) for evidence of inflammation.
- Is there an inflammatory leukogram? This would be supported by a left shift (immature neutrophils in the circulation) and toxic change in neutrophils (which are usually found together, but not always).
- If there is an inflammatory leukogram, how severe is it? This can be ascertained by the severity of the left shift (degenerative generally supports a severe inflammatory response) and degree of toxicity in neutrophils (marked toxic change in neutrophils would support severe inflammation).
- If there is inflammation, is the bone marrow responding? If there is a neutrophilia and mature neutrophils outnumber immature neutrophils (and there is a decent left shift, say >1,000/uL of band or immature neutrophils), this would support a bone marrow response. Some clinical pathologists use the term “regenerative left shift” under these conditions, since they suspect a bone marrow response is occurring (i.e. myeloid hyperplasia), but it is possible for the bone marrow to release a few immature neutrophils along with mature neutrophils in the storage pool in response to inflammation before the bone marrow has had time to increase granulopoiesis (i.e. first few days after onset of inflammation). So this all depends on the degree of neutrophilia and left shift, and with severity of inflammation.
- If there is inflammation, who is winning? The animal or the inflammation? This can be difficult to determine from a single hemogram and is somewhat species dependent. For example, a degenerative left shift, more immature than mature neutrophils in the face of a reduced (neutropenia) or within reference interval mature (segmented) neutrophil count in a dog, cat, horse or camelid would suggest depletion of marrow stores and failure of the bone marrow to keep up with the demand from the tissue, i.e. the inflammation is winning. In ruminants, species who have only low marrow stores that can be released in response to acute inflammation, a degenerative left shift with neutropenia is an expected finding in an acute inflammatory response (e.g. mastitis, metritis) and does not mean the inflammation is winning. But if the ruminant still has a degenerative left shift 3-4 days later, than the inflammation is winning. If the animal has a high mature neutrophil count (neutrophilia) and more immature than mature neutrophils, this tells us that the marrow has had time to respond (there is a myeloid or neutrophilic hyperplasia) but the inflammation is acutely worsening or a new inflammatory focus (severe) has developed (with cytokines causing release of immature cells from the marrow). Here, we are not sure who is winning. So how do we tell? When in doubt, always do serial hemograms – every 24 hours (or less if really needed)! If the mature neutrophil count goes up and evidence of toxic change and immature neutrophil count goes down…that is a good thing – the animal and you as the veterinarian are winning. If the mature neutrophil count is going down and toxic change or immature neutrophil count is going up….that is bad – the animal is “circling the drain” as it were.
- Are there abnormal cells in the blood (“big blue cells“) or an unexplained lymphocytosis? If yes, then you may have a leukemia (acute, chronic or the leukemia phase of lymphoma). Please refer to the leukemia section for further diagnostic algorithms on leukemia.
Note, that a left shift in blood does not always mean there is a bone marrow response (myeloid or neutrophilic hyperplasia). A mild left shift in animals other than ruminants, can be seen with release of the storage pool in response to inflammation or if marrow reserves have been previously depleted. A more severe left shift is expected in ruminants in acute inflammation without a myeloid hyperplasia. Also, the lack of a left shift does not mean there is no myeloid hyperplasia. If the bone marrow is responding to granulocytopoietic cytokines or an inflammatory stimulus and is keeping up with demand, you may see no left shift at all, but you would expect to see a neutrophilia (high mature or segmented neutrophil count). You are also unlikely to see toxic change in neutrophils in this scenario because the marrow is keeping up with demand. This is typical in the case of sequestered inflammation or paraneoplastic leukocytosis, where tumor cells release granulocytopoietic cytokines.