
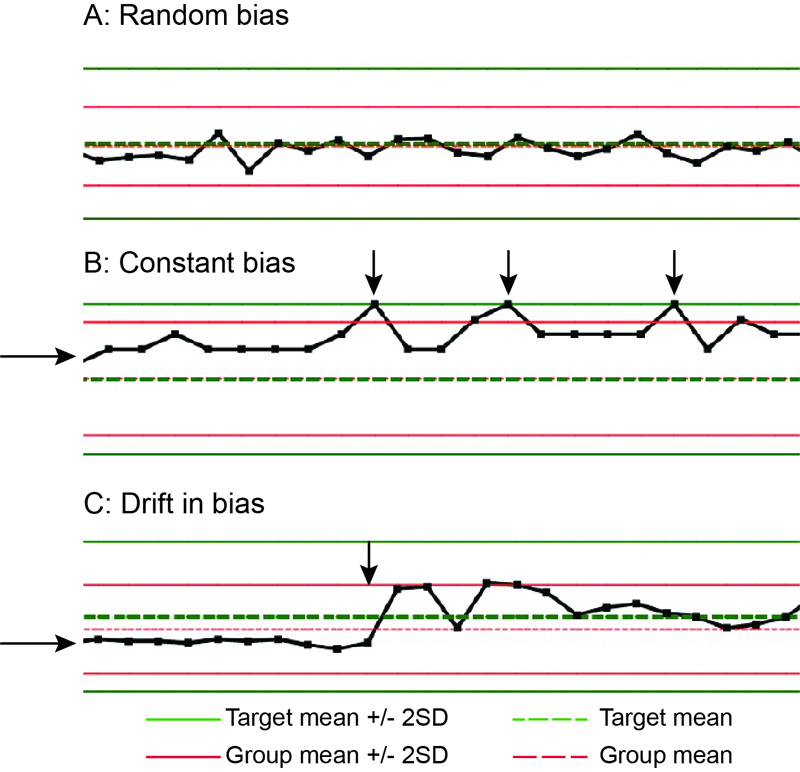
Quality control material are run daily and monitored over time: The results for the instrument over time is the black line with the red results indicating the mean (red dashed line) and 2SD (+ and -, solid red lines) of all the results compiled from thousands of laboratories using your type of instrument for that test. The green lines indicate the target or expected mean (dashed green line) and 2SD (solid green lines).
A: Random bias: The control result from the instrument runs randomly above or below the target and group mean. The group 2SD is broader than the SD obtained from all the laboratories for the control material. B: Constant bias:
The control material (horizontal arrow) is running consistently above the mean and with time shows more imprecision with some values (vertical arrows) being right at the upper limit of the acceptable range (target mean +/- 2SD). C: Instrument drift or drift in bias: The control material starts off with a constant negative bias (horizontal arrow), but is actually closer to the group mean (red dashed line) than the target mean (green dashed line) indicating that a mild constant negative bias is a consistent finding across laboratories. However, over time, there is more imprecision (higher amplitude of results) and the mean of the control shifts closer to the target mean (vertical arrow) and then stabilizes with more random bias. A sudden shift like this could indicate an instrument problem, which should be addressed and rectified. However, in this case, the instrument was calibrated and the control results became more consistent around both group and target means.